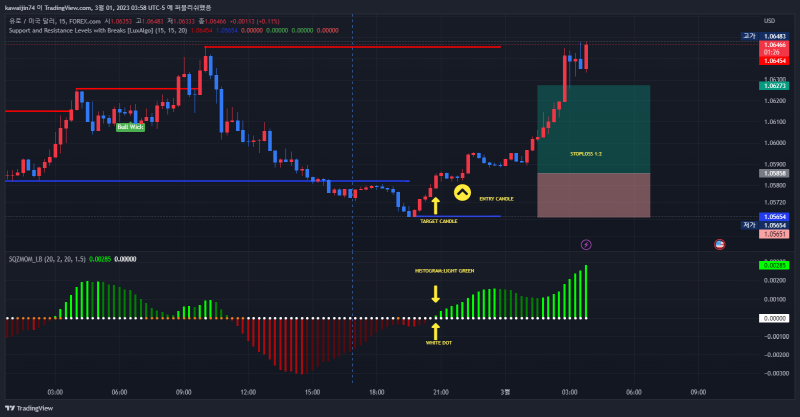
The Squeeze Momentum Indicator (SMI) is a technical analysis tool used to identify periods of consolidation in a market and predict potential breakouts. Here are the steps to use the SMI:
- Find a charting platform that offers the SMI indicator. Most popular charting platforms like TradingView, MetaTrader, or ThinkorSwim offer this indicator.
- Add the SMI indicator to your chart. The SMI consists of three lines: the SMI line, the SMI histogram, and the SMI reference line.
- Interpret the SMI line. The SMI line is the main line and shows the momentum of the market. If the SMI line is above the zero line, it indicates bullish momentum, and if it's below the zero line, it indicates bearish momentum.
- Analyze the SMI histogram. The histogram is a visual representation of the distance between the SMI line and the SMI reference line. When the histogram is blue, it indicates that the market is in a squeeze, which means that volatility is low, and there is potential for a big move in either direction.
- Watch for breakouts. When the histogram turns red, it indicates that the market is breaking out of the squeeze, and a significant move is likely to occur. A positive breakout occurs when the SMI line moves above the zero line, and a negative breakout occurs when the SMI line moves below the zero line.
- Use other technical indicators for confirmation. It's always good to use other technical indicators such as moving averages or volume indicators to confirm the SMI's signals before making any trades.
- Set stop-loss orders. As with any trading strategy, it's important to manage your risk by setting stop-loss orders to limit your losses if the market moves against your position.
Remember that no indicator is 100% accurate, and it's always a good idea to combine different indicators and analysis techniques to make informed trading decisions.
'trading strategy' 카테고리의 다른 글
| 4-hour chart with 50 Exponential Moving Average (EMA) strategy (0) | 2023.03.10 |
|---|
댓글